Thursday 31 December 2020

A new code example for the "Qt Performance" book


Recently I added a new example* to my "Qt5 Performance" book's resources that I didn't manage to include in the original release - the trace macros creating output in chrome:tracing format. 

I think it's a very cool technique - instrument your code and than inspect the result as a graphic! On Linux we have flame graph support in the standard tooling integrated with Qt Creator.

On Windows, however, we do not have such a thing! And because I decided to use Windows as the deveolpment platform for my book, we have a kind of problem here, so creative solutions are needed!

And I already came up with an idea for that in the book - we can use libraries (like minitrace, the library we are using in this example ) to generate profiling output in a format that the Chrome's** trace viewer will understand! You didn't know that Google's Chrome had a built-in profiler? Some people assume it’s only for profiling “web stuff” like JavaScript and DOM, but we can use it as a really nice frontend for our own profiling data.

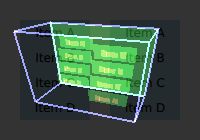
However, due to lack of time I couldn't try it out when I was writing the book 😞, but with the new example I added  I was able to generate output you see visualizedin the figure below:


Here is the code example I used - as you can see, you have only to insert some MTR_() macros here and there:
  int main(int argc, char *argv[])
  {
    mtr_init("trace.json");

    MTR_META_PROCESS_NAME("QmlWithModel");
    MTR_META_THREAD_NAME("Main GUI tread");
    MTR_BEGIN("main", "main()");

    QCoreApplication::setAttribute(Qt::AA_EnableHighDpiScaling);
    QGuiApplication app(argc, argv);

    QStringList countryList;
    countryList << "Thinking...";

    MTR_BEGIN("main", "load QML View");
    QQuickView view;
    QQmlContext *ctxt = view.rootContext();
    ctxt->setContextProperty("myModel", QVariant::fromValue(countryList));

    view.setSource(QUrl("qrc:/main.qml"));
    view.show();
    MTR_END("main", "load QML View");

    // get country names from network
    MTR_BEGIN("main", "init NetworkMgr");
    QNetworkAccessManager networkManager;
    MTR_END("main", "init NetworkMgr");
 
    ....

PS: heob-3 (i.e the new version of the heob memory profiler we discussed in the book) has a sampling profiler with optional flame graph output!!! I think I have to try it out in the near future!

--
* you can find the new example here, and the generated JSON file here

** Chrome browser's about:tracing tool. You can use it like this:

  • go to chrome://tracing in Chrome
  • click “Load” and open your JSON file (or alternatively drag the file into Chrome)
  • that's all

More about basic QML optimizations


You might perhaps already know that I recently wrote a book (blogged about it here)! In the book we discuss various general program performance topics but also some more specific, Qt related ones, for example Qt's graphical or networking performance.

Recently, as I was watching some QML presentation I realized that some very basic pieces of performance advice I just glossed over in the book could (and should) be explained in a much more detailed manner to build a general understanding of this technology's caveats.

In Chapter 8.4, where the book discusses QML's performance, I simply wrote that:
"If an item shouldn't be visible, set its visible attribute to false, this will spare the GPU some work. In the same vein, use opaque primitives and images where possible to spare GPU from alpha blending work."
As I re-read this section on some occasion I somehow had to notice that what seemed pretty clear in writing, isn't that clear when read a year later! I started to think why this passage is not that lucid as it should be, and I noticed, that my intended formatting was gone! Now we have in the book:
"... set its visible attribute to false" 
instead of
"... set its visible attribute to false"
as I wrote it initially!!! The formatting went somehow missing and I didn't notice it while proofreading. For me this change rendered the sentence pretty unintelligible :-/.

But anyway, I could have explained it in a little more detailed manner* - so let's try to make a better job and explain why the visible attribute is so important!

To state it bluntly - QML won't do any optimizations to prevent drawing items the user cannot see, like items which are out of bounds or are completely obscured or clipped** by other items! It just draws every single item with visible set to true, totally unconcerned with its real visibility! So we have to optimize manually and:
"... set its visible attribute to false"
But how on earth should we know which items are invisible in which situation? Easy, just set this environment variable: QSG_VISUALIZE=overdraw and Qt will show the overdrawn items using a different color and making them visible as can be seen in this pic from Qt documentaion:


That's pretty cool!

This was my state of knowledge until recently (learned about that in this KDAB presentation) but than I read this line in Qt Quick 2D Renderer's documentation:
Qt Quick 2D Renderer will paint all items that are not hidden explicitly with either the visibility property or with an opacity of 0. Without OpenGL there is no depth buffer to check for items completely obscured by opaque items, so everything will be painted - even if it is unnecessary.
Qt Quick 2D Renderer is a raster-graphic replacement for the standard OpenGL-based QML renderer. Does that (by tertium non datur) mean that with OpenGL we do use the depth buffer after all? This could be an unfortunate formulation, so we'd like to stay on the conservative side but maybe a little more investigation would be appropriate in this case. Have you heard anything about it?

--
* This might be due to the very tight deadlines :-(

** as Qt documentation says:
"If clipping is enabled, an item will clip its own painting, as well as the painting of its children, to its bounding rectangle."